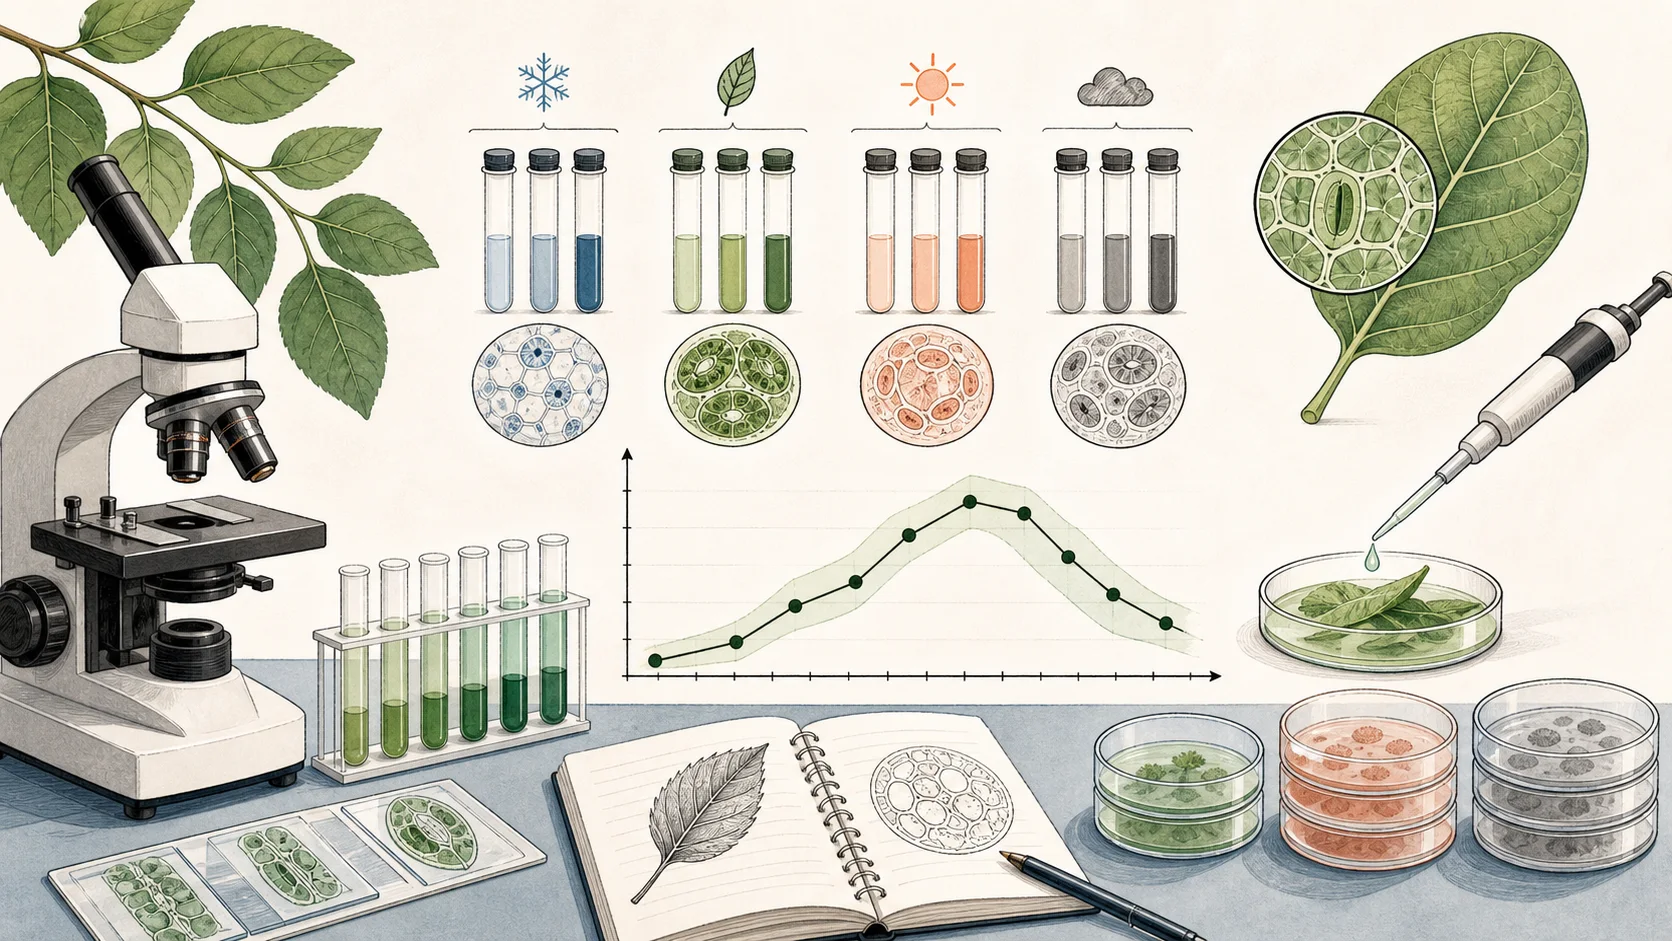
Start with the question, not the graph
Before interpreting results, identify what the experiment was designed to test. Rewrite the research question in a simple form: How does the independent variable affect the dependent variable? This sentence reveals the logic of the design and helps prevent a common error: describing a pattern without explaining what was manipulated and measured.
Map the experimental design
- Independent variable: the factor deliberately changed by the investigator.
- Dependent variable: the response measured as data.
- Control group: a reference condition that shows what happens without the treatment or under a standard condition.
- Controlled variables: conditions kept as consistent as possible so they do not become alternative explanations.
- Replicates: repeated observations or independent samples used to estimate natural variation and improve reliability.
A strong experiment changes one main factor, measures a relevant outcome, includes an appropriate comparison, and uses enough replication to distinguish a real pattern from random variation.
Read a graph in layers
- Axes and units: identify both variables, their units, and whether the scale is linear or transformed.
- Overall pattern: look for increase, decrease, plateau, optimum, threshold, cycles, or no clear relationship.
- Magnitude: compare actual changes, not just the visual steepness of a line.
- Variation: inspect individual points, ranges, standard deviations, confidence intervals, or error bars.
- Exceptions: note outliers or conditions that do not follow the main trend, but do not discard them without evidence.
Example: temperature and enzyme activity
Imagine an enzyme experiment records reaction rates of 2.1, 3.4, 4.6, 2.7, and 0.8 units per minute at 20, 30, 40, 50, and 60 degrees Celsius. The data increase to the highest measured rate at 40 degrees Celsius and then decline.
A careful conclusion is that the optimum lies near 40 degrees Celsius under the tested conditions. It would be too strong to claim that the exact optimum is 40 degrees because temperatures between the measured points were not tested.
A plausible mechanism has two parts. Moderate warming increases molecular motion and productive collisions. At higher temperatures, changes in protein structure can reduce the active site's ability to bind and catalyze the reaction. The data support a temperature-dependent optimum, while the structural explanation would need additional evidence to be confirmed directly.
What error bars can and cannot tell you
Error bars summarize variation or uncertainty, but their meaning depends on what they represent. Standard deviation describes spread among observations; standard error estimates uncertainty in a sample mean; a confidence interval estimates a range for the population value under stated assumptions. Always check the graph caption before interpreting overlap. Visual overlap alone is not a universal significance test.
Build an answer with claim, evidence, and reasoning
- Claim: answer the research question directly and with appropriate limits.
- Evidence: cite a specific comparison or trend, including values and units when available.
- Reasoning: connect the evidence to a biological mechanism or principle.
For the enzyme example: Activity is greatest near 40 degrees Celsius in the tested range is the claim. The rate rises from 2.1 at 20 degrees to 4.6 at 40 degrees, then falls to 0.8 at 60 degrees is the evidence. Collision frequency and heat-related changes in enzyme structure provide the reasoning.
Correlation is not automatically causation
An observational study can reveal that two variables change together, but hidden variables may influence both. A causal claim is stronger when the suspected cause is manipulated, other conditions are controlled, assignment reduces bias, and results are replicated. In biological systems, causation may also require a plausible mechanism supported by further experiments.
A checklist for exam questions
Identify the variables and control, describe the pattern with numbers, interpret the uncertainty, propose a mechanism, state one limitation, and suggest a follow-up that changes only one relevant factor. This sequence turns a vague graph description into a defensible scientific explanation.
Connect the temperature–activity example to the biology in enzymes and environmental impacts on enzyme function. Revisit the graph with the distinction between measured evidence and a proposed mechanism in mind.