AP Biology · Unit 3 · Topic 3.5
Cellular Respiration
Cellular respiration transfers energy from fuel oxidation into forms that support cellular work. Instead of memorizing disconnected stages, track where carbon goes, who carries electrons, and how ATP is made. Then test the model against oxygen measurements and pathway disruptions.
Learning Goals
- Locate the major stages in a eukaryotic cell and explain their connections.
- Distinguish substrate-level phosphorylation from oxidative phosphorylation.
- Explain oxygen's role and why regenerating NAD+ matters.
- Predict different effects of electron-transport inhibition and uncoupling.
- Graph and calculate oxygen-consumption rates with appropriate controls.
Focus on mechanisms, compartments, and evidence. The bookkeeping examples support those ideas; memorizing every intermediate and enzyme is not the purpose of this lesson.
1. Start with Atoms and Electrons
This overall account summarizes complete aerobic glucose oxidation, not a single reaction. Some released energy supports ATP synthesis and some disperses as heat. Fuel carbon becomes CO₂; oxygen accepts electrons at the end of the aerobic electron transport chain and is reduced to water. Oxygen is not directly used by glycolysis.
Prediction: carbon-labeled glucose can produce labeled CO₂ as its carbon is oxidized. This does not mean the inhaled O₂ molecule is simply attached to each glucose carbon. Carbon removal and terminal electron acceptance occur in different reactions.
2. A Stage Map with Separate Accounts
| Stage and location | Carbon outcome | Reduced carriers produced | Direct ATP gain |
|---|---|---|---|
| Glycolysis: cytosol | Two 3-carbon pyruvates | 2 NADH | 2 net ATP |
| Pyruvate oxidation: matrix | Two 2-carbon acetyl groups; 2 CO₂ released | 2 NADH | 0 |
| Citric acid cycle: principally matrix | 4 CO₂ released per two turns | 6 NADH and 2 FADH₂ | 2 ATP equivalents |
| Oxidative phosphorylation: inner membrane | No direct carbon removal | Carriers are reoxidized | Gradient-dependent; variable yield |
These are pathway totals, not an isotope map proving that newly entering acetyl carbons leave in the first turn. The cycle regenerates its carbon acceptor. NADH is an electron carrier, not an ATP molecule.
3. Glycolysis Can Continue Only if NAD+ Returns
Glycolysis invests 2 ATP and produces 4, for a net gain of 2 per glucose. It also reduces NAD+ to NADH. Sustained operation requires reoxidation of that NADH. The absence of a direct oxygen-requiring step does not remove this need for carrier recycling.
Worked accounting: five glucose molecules enter glycolysis
ATP investment is \(5\times2=10\); gross ATP production is \(5\times4=20\); net gain is 10. The pathway yields 10 pyruvates and 10 NADH. Do not report 20 ATP as the net gain or add NADH to the ATP count.
4. Oxidation Feeds the Electron Carriers
Pyruvate oxidation supplies acetyl-CoA to the citric acid cycle. Carbon-removal reactions release CO₂ while oxidation transfers electrons to carriers. A small amount of ATP or its equivalent is made directly; much of the transferable energy leaves these stages in reduced carriers.
Apply the connection: if the respiratory chain can no longer reoxidize carriers, oxidized NAD+ becomes less available and upstream oxidation can slow. These stages depend indirectly on a functioning aerobic chain even though their carbon-removal reactions do not directly consume O₂.
5. Membrane Organization Connects Electron Flow to ATP
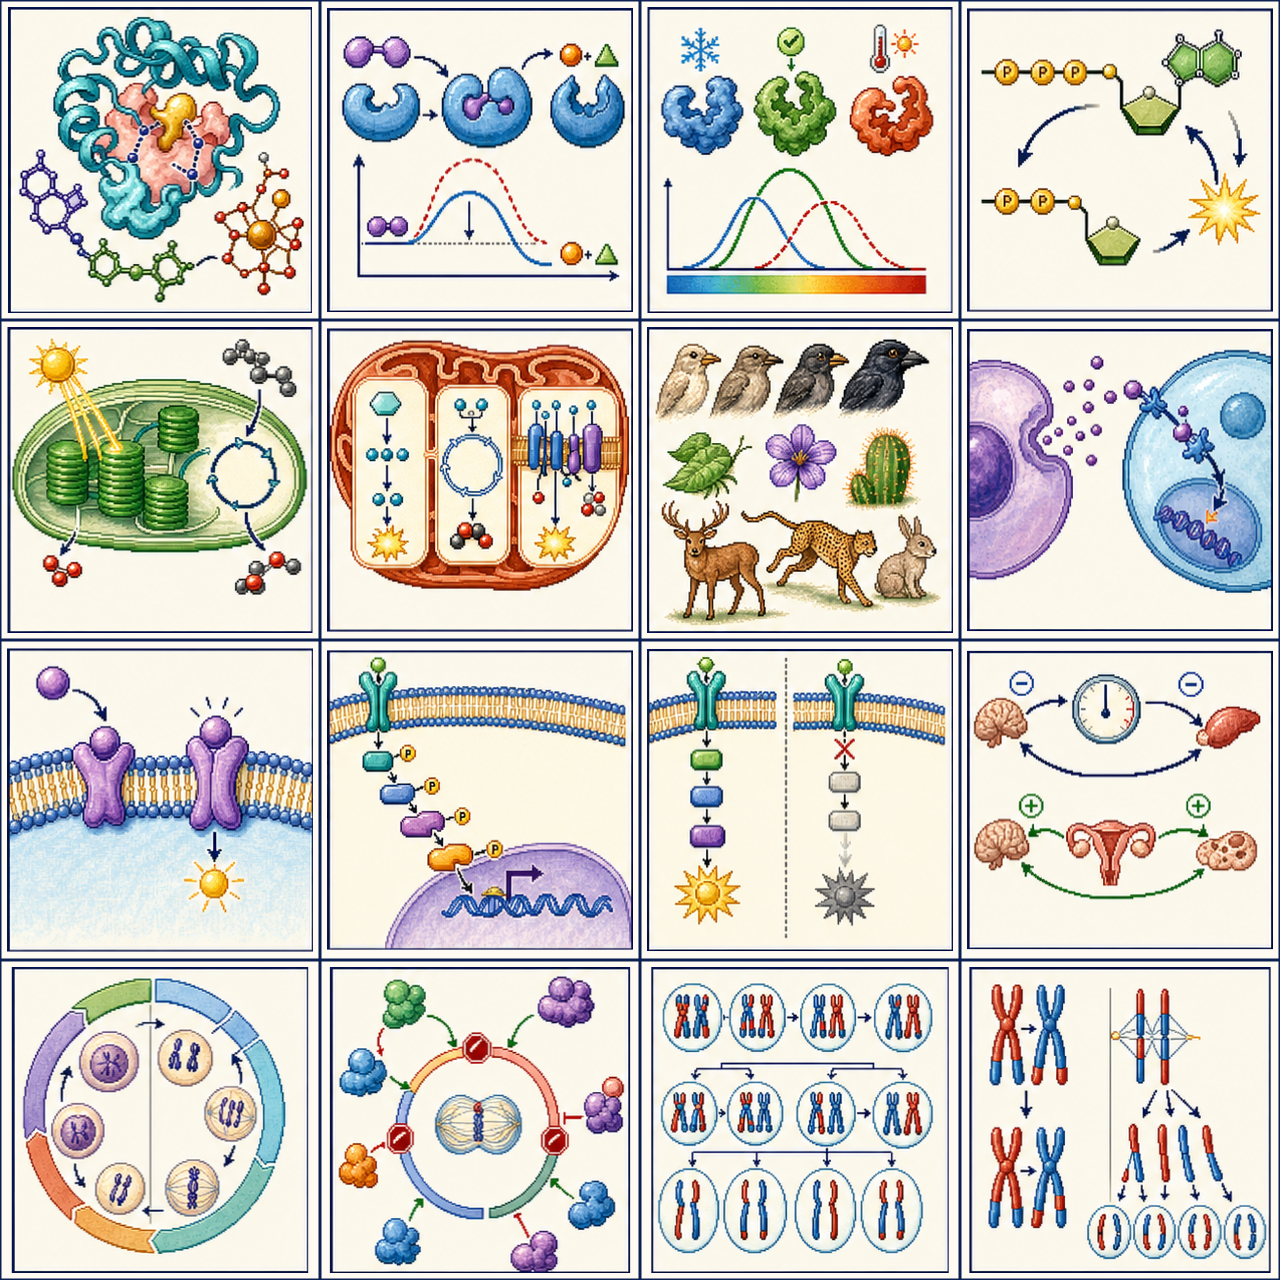
Electron transfer supports proton movement from the matrix into the intermembrane space. Protons then return through ATP synthase, coupling downhill electrochemical movement to ATP formation. Electrons do not travel through ATP synthase. Cristae increase inner-membrane area available for this machinery.
Respiring prokaryotes lack mitochondria and instead use an appropriate cellular membrane. The mechanism requires compartment separation, not the organelle's name.
6. Two Ways to Phosphorylate ADP
Substrate-level phosphorylation directly transfers phosphate from a reacting substrate to ADP. Oxidative phosphorylation couples carrier oxidation to a proton gradient and ATP synthase. A small direct yield can therefore persist even when mitochondrial ATP production is impaired.
Optional yield exercise: an idealized account provides 10 NADH, 2 FADH₂, and 4 substrate-level ATP equivalents per glucose. If the exercise assumes 2.5 ATP per NADH and 1.5 per FADH₂, the estimate is \(10(2.5)+2(1.5)+4=32\). This is conditional bookkeeping, not a fixed yield for every cell. Cytosolic electron shuttles, transport costs, proton leak, and competing uses alter the result.
7. Fermentation Solves a Carrier-Recycling Problem
In lactate fermentation, pyruvate accepts electrons from NADH, regenerating NAD+. Alcohol fermentation releases CO₂ and ultimately forms ethanol while recycling NAD+. In these common pathways, the fermentation reactions add no ATP beyond glycolysis; their importance is enabling glycolysis to continue.
Anaerobic respiration is different: it uses an electron transport chain with a terminal acceptor other than oxygen. “Without oxygen” therefore does not uniquely identify fermentation.
Why might sugar fail to restore ATP production?
If a cell cannot reoxidize NADH and its oxidized NAD+ pool becomes depleted, adding glucose does not solve that bottleneck. A route for carrier recycling is needed. Substrate availability alone does not guarantee pathway flux.
8. Compare Inhibition with Uncoupling
| Perturbation | Oxygen consumption | Oxidative ATP production | Reason |
|---|---|---|---|
| Terminal electron transfer blocked | Falls | Falls | Electron exit is restricted |
| ATP synthase blocked | Often slows after gradient buildup | Falls | Proton return is restricted; gradient opposes further pumping |
| Controlled proton leak | May increase | Falls per oxygen consumed | Electron flow is less constrained, but gradient energy bypasses ATP synthesis |
Predictions depend on dose, substrate supply, membrane integrity, and observation time. An uncoupler does not necessarily stop electron flow; faster oxygen use does not necessarily mean more ATP.
9. Graph Oxygen Consumption
Calculate the blank-corrected rate
Sample consumption is \((200-152)/6=8\ \mathrm{\mu M/min}\). Blank decline is \((200-194)/6=1\ \mathrm{\mu M/min}\). If the blank captures comparable additive background drift, corrected consumption is \(8-1=7\ \mathrm{\mu M/min}\).
For a 2.0 mL liquid chamber, \(7\ \mathrm{\mu mol\,L^{-1}\,min^{-1}}\times0.0020\ \mathrm L=0.014\ \mathrm{\mu mol/min}\), or 14 nmol/min. This conversion assumes a well-mixed liquid volume without an unaccounted gas reservoir or oxygen exchange.
10. Design the Experiment Around the Claim
To compare respiration across samples, match temperature, oxygen availability, chamber volume, mixing, and substrate conditions. Normalize by a justified measure such as living tissue mass or cell number. Use independent biological replicates and report variability of independently estimated slopes.
A chamber blank detects background changes but does not reproduce all tissue effects. Plant samples measured in light can also produce oxygen by photosynthesis; dark measurements address that confound but introduce a different physiological condition.
Claim-evidence-reasoning example: the sample in Section 9 consumes oxygen faster than the blank, with a corrected decline of 7 μM/min. This is consistent with oxygen acting as a terminal electron acceptor in aerobic metabolism. The measurement alone neither proves glucose is the only fuel nor determines ATP yield.
11. Check Your Understanding
1. Where does the proton concentration rise during mitochondrial electron transport?
In the intermembrane space relative to the matrix. ATP synthase permits coupled return toward the matrix.
2. Does the citric acid cycle make most ATP directly?
No. Its major energetic outputs are reduced carriers. Their electrons support oxidative phosphorylation when the downstream system is functional.
3. Can oxygen consumption rise while ATP production becomes less efficient?
Yes. Proton leak can uncouple electron flow from ATP synthesis. More fuel oxidation may then be needed for the same ATP output, with more energy dissipating as heat.
4. Why does oxygen loss affect reactions that do not directly use it?
The aerobic chain cannot sustain terminal electron transfer, so reduced carriers accumulate and oxidized carriers become limiting upstream. Some cells maintain glycolysis through fermentation.
5. Do plants carry out cellular respiration?
Yes. Photosynthesis and respiration are distinct processes that can occur in the same plant. A net gas measurement can conceal simultaneous opposing fluxes.
Keep carbon loss, electron transfer, proton movement, and ATP formation in separate accounts. Use the connections between them to explain data rather than assuming that more oxygen consumption always means more ATP.
Concept references: OpenStax Biology 2e, Glycolysis, Pyruvate Oxidation and the Citric Acid Cycle, Oxidative Phosphorylation, and Metabolism without Oxygen; scope checked against the College Board AP Biology Course and Exam Description, Topic 3.5. Explanations, diagrams, simulated measurements, and worked questions are independently authored for Insomnia Studyroom. Reference figures and activity sheets are not reproduced.
Official curriculum reference: College Board AP Biology course page. The explanation and worked example are independently written for this study site.