Prealgebra · Unit 10 · Topic 10.2
Tables and Graphs of Linear Equations
Build a table of solution pairs for a linear equation, plot its graph, check points by substitution, and recognize vertical and horizontal lines.
From an equation to locations
A single ordered pair names one place on the coordinate plane. An equation such as \(y=3x-2\) does something different: it gives a rule for many pairs. Here \(x\) is an input, \(y\) is the output, and both are numbers measured in coordinate units. Once we choose \(x\), the equation tells us which \(y\) belongs with it.
An ordered pair \((x,y)\) is a solution only if substituting both coordinates makes the equation true. For instance, \((1,1)\) works because \(1=3(1)-2\). The pair \((1,2)\) does not: \(2\ne3(1)-2=1\). Plotting a point is not enough to make it a solution; the equation decides whether the point belongs on its graph.
Build a table for \(y=3x-2\)
Choose a few convenient \(x\)-values, including zero and values on both sides of it. Calculate each \(y\) before plotting:
\[ \begin{aligned} x=-1&:\quad y=3(-1)-2=-5,\\ x=0&:\quad y=3(0)-2=-2,\\ x=1&:\quad y=3(1)-2=1,\\ x=2&:\quad y=3(2)-2=4. \end{aligned} \]
| \(x\) | Calculation for \(y\) | \(y\) | Point \((x,y)\) |
|---|---|---|---|
| \(-1\) | \(3(-1)-2\) | \(-5\) | \((-1,-5)\) |
| \(0\) | \(3(0)-2\) | \(-2\) | \((0,-2)\) |
| \(1\) | \(3(1)-2\) | \(1\) | \((1,1)\) |
| \(2\) | \(3(2)-2\) | \(4\) | \((2,4)\) |
The last column is ready to plot: take the first coordinate horizontally, then the second vertically. In particular, \((0,-2)\) is on the \(y\)-axis because its \(x\)-coordinate is zero. The line crosses that axis at \(y=-2\), which is exactly what the table shows.
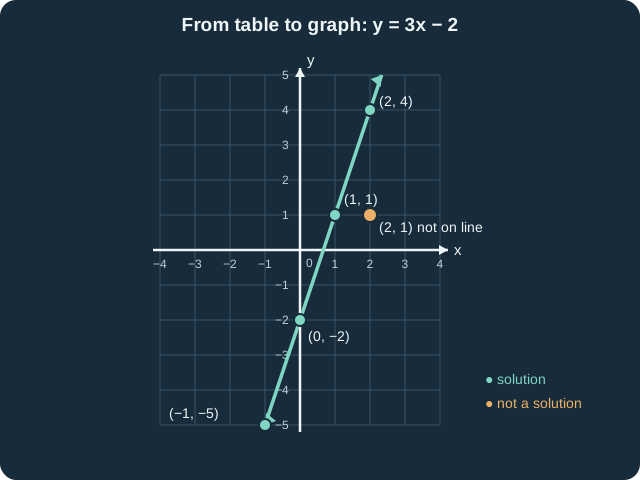
The table gives only four examples, but the graph is the whole line. For every real value of \(x\), the rule \(y=3x-2\) gives another point, including values between the table entries. If \(x=1.5\), for example,
\[ y=3(1.5)-2=2.5, \]
so \((1.5,2.5)\) lies between \((1,1)\) and \((2,4)\). The line continues in both directions beyond the drawn grid; it does not stop at the first or last table row.
Why is it straight? Each increase of 1 in \(x\) changes \(3x\) by 3, while the \(-2\) stays fixed. Thus the output rises by the same amount for each equal horizontal step:
\[ \Delta x=1\quad\Longrightarrow\quad\Delta y=3. \]
The equal changes are visible in the table: \(-5,-2,1,4\) rise by 3 each time. A table of calculated points should line up for this equation. If one plotted point does not, recheck the substitution, coordinate order, and axis scale before drawing a line through it.
Check a point that is not on the line
The amber point in the graph is \(P=(2,1)\). At \(x=2\), the equation requires
\[ y=3(2)-2=4, \]
not 1. Substituting the proposed pair gives \(1\ne4\), so \(P\) is not a solution. It shares the same \(x\)-coordinate as the solution \((2,4)\), but sits three grid units below it. This is a useful way to check a graph: points on the line satisfy its equation, and points away from it do not.
Lines with a constant coordinate
Not every linear equation is written as \(y=mx+b\). In \(x=2\), the \(x\)-coordinate must always be 2 while \(y\) may be any number. The points \((2,-1)\), \((2,0)\), and \((2,3)\) therefore form a vertical line. In \(y=-1\), the \(y\)-coordinate must always be \(-1\) while \(x\) may vary, giving a horizontal line. The conditions are
\[ x=a\quad\text{(vertical line)},\qquad y=b\quad\text{(horizontal line)}, \]
where \(a\) and \(b\) are fixed numbers. A vertical line \(x=a\) cannot be rewritten as \(y=mx+b\) for one fixed \(m\): the same \(x=a\) occurs with many different \(y\)-values. Recognizing that exception prevents us from trying to make every line from a table by choosing different \(x\)-values.
Further reading
The solution-pair and table method was checked against OpenStax Prealgebra 2e §11.1; the line graph and constant-coordinate cases against OpenStax Prealgebra 2e §11.2. The prose, point choices, checks, table, and graph here were independently created; no textbook text, exercises, or artwork were reproduced.